


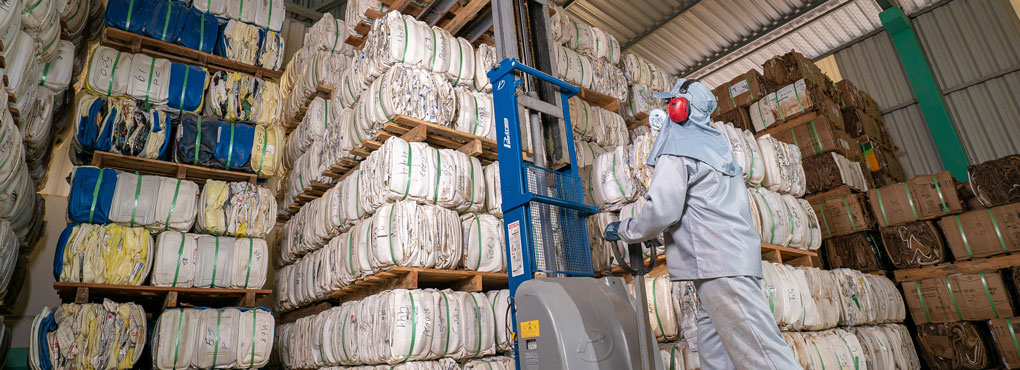
A worker at the Contenda (PR) station, one of the units that started being managed by inpEV in 2019.
GRI 103-2 and 103-3
To boost employee development besides attracting and retaining talents is the main people management strategic goal of inpEV, carried out by the Human Resources area with involvement of all leadership.
The number of employees at inpEV more than doubled between 2018 and 2019.
In 2019, with the start of the receiving stations incorporation process, the Institute more than doubled the number of employees, from 82 professionals by the end of 2018 to 185 in the following year. Most of the new employees already worked at the units previously managed by wholesale associations and cooperatives, and were kept by inpEV, thus valuing their expertise and ensuring that the knowledge of the Campo Limpo System was not lost. This decision is also in line with inpEV’s positioning, which prioritizes the use of internal talents, thus valuing and developing professionals specializing in reverse logistics of empty crop protection packaging.
| TOTAL EMPLOYEES GRI 102-8 | Permanent contracts | Temporary contracts | Total |
|---|---|---|---|
| By gender | |||
| Males | 125 | 0 | 125 |
| Females | 59 | 1 | 60 |
| Per region1 | |||
| South Region | 32 | 0 | 32 |
| Southeast Region | 103 | 1 | 104 |
| Center-West Region | 34 | 0 | 34 |
| Northeast Region | 15 | 0 | 15 |
| Per type of shift | |||
| Full-time | 177 | 1 | 178 |
| Part-time | 7 | 0 | 7 |
| Total2 | 184 | 1 | 185 |
1 - There are no employees in the North region of the country.
2 - Of the 185 employees, seven are third-party professionals and are located at the Institute’s headquarters in São Paulo (SP), and carry out support activities.
TEAM PROFILE GRI 102-8


DEVELOPMENT CYCLE GRI 404-3 and 404-1
As part of the Contract Results and Performance Assessment (ADCR), every year the employees of the administrative area and those holding supervisory, coordination, managerial and director positions jointly define with their leader the individual goals and carry out a performance assessment, which includes a self-assessment and evaluation by their direct leader. In 2019, all eligible employees (those with the Institute for over a year in assistant, analyst, supervisor, coordinator, manager and director positions) underwent the assessment, which considers nine aspects, among which are technical performance, personal commitment and teamwork.
These processes support the Individual Development Plan (PDI), which establishes the training courses to be attended for each employee. Another assessment process takes place every two years. This is the Potential Assessment Program where all leaders meet with the Executive Board to identify professionals with potential to take on leadership roles in the future and define the development strategy for each one. For 2020, it is expected to structure the Leadership Development Program, in partnership with the International Coaching Institute (ICI).
In 2019, the training courses matrix for the administrative area contained more than 20 competencies (technical and behavioral). The EAD course about the Campo Limpo System, which received a new platform in 2019, also became a part of the training syllabus.
For the operational workforce, the orientation training courses for the central station employees that started being managed by inpEV were prioritized. Training courses on operational procedures and safety were also held.
In 2019, the Institute’s 185 employees received 10,595 hours of training, an average of 57.27 hours of training per employee. Among the administrative team, the average reached 35.88 hours of training per employee; for the operational team, which acts at the receiving stations, the average was 49.83 hours of training per professional.
AVERAGE TRAINING (H) GRI 404-1 | Collaborators | Hours | Average |
|---|---|---|---|
Per functional category | |||
High governance | 0 | 0 | 0.00 |
Directors | 1 | 1.5 | 1.50 |
Managers | 9 | 48.5 | 5.39 |
Coordinators | 19 | 224 | 11.79 |
Receiving station Coordinators/Supervisors | 27 | 947.5 | 35.09 |
Administrative | 29 | 1,040.50 | 35.88 |
Operational | 92 | 4,584.50 | 49.83 |
Apprentices | 5 | 97 | 19.40 |
Interns | 3 | 113 | 37.67 |
Per gender | |||
Males | 125 | 8,448.00 | 67.58 |
Females | 60 | 2,146.50 | 35.78 |
Total | 185 | 10,595 | 57.27 |
SAFETY OF THE CAMPO LIMPO SYSTEM GRI 403-2
Safety is one of inpEV’s values and is one of its management’s goals. In line with all safety standards, since 2018 the Institute also has a Safety and Health Management System, which ensures risk identification and monitoring and process standardization in order to prevent accidents and occupational diseases.
Safety is another pillar of the Campo Limpo System, which invests in training and awareness campaigns for the System employees, among other activities.
In order to consolidate this culture among all System professionals, the 1st Internal Labor Accident Prevention Week (Sipat) of the Campo Limpo System was organized. By focusing on self-care and carrying the theme “You are the mostly responsible for your own safety”, lectures and activities were held simultaneously at 100 receiving stations and at the inpEV headquarters.
Besides Sipat, specific training courses were held, besides awareness campaigns, installation of safety warnings and signs, equipment adjustments and standardization of work procedures at the stations managed by inpEV, including those that started being managed by the Institute during 2019. The Health and Safety area was also reinforced by hiring one more specialist dedicated to process safety.
In 2019, the injury rate and severity rate (lost days) increased when compared to the previous year. The absenteeism rate dropped, going from 1.92 in 2018 to 1.16 in 2019. The indicator scope includes employees at the inpEV headquarters and at the six receiving stations already under the Institute’s management prior to January 1, 2019, which allowed a 12 month monitoring period along the year. The different results for males and females are due to the fact that most women carry out administrative functions, where exposure to risk is low. The difference in results among regions is explained by the higher volume of packaging collected in the South, Southeast and Center-West regions, which results in a higher number of employees at the stations in these three regions.
HEALTH AND SAFETY PER GENDER1 GRI 403-2 | 2017 | 2018 | 2019 | ||||||
|---|---|---|---|---|---|---|---|---|---|
Male | Female | Total | Male | Female | Total | Male | Female | Total | |
Injury rate2 | 22.50 | 0.00 | 12.20 | 15.40 | 0.00 | 9.79 | 21.78 | 11.42 | 17.75 |
Occupational illnesses rate | 0.00 | 0.00 | 0.00 | 0.00 | 0.00 | 0.00 | 0.00 | 0.00 | 0.00 |
Severity rate3 | 112.50 | 0.00 | 61.20 | 30.81 | 0.00 | 19.59 | 36.3 | 22.84 | 31.07 |
Absenteeism rate4 | 0.00 | 0.00 | 0.00 | 1.21 | 0.02 | 1.92 | 1.52 | 0.61 | 1.16 |
Number of deaths | 0 | 0 | 0 | 0 | 0 | 0 | 0 | 0 | 0 |
HEALTH AND SAFETY PER REGION1 – 2019 GRI 403-2 | South | Southeast | Midwest | North | Northeast | Total |
|---|---|---|---|---|---|---|
Injury rate2 | 45.91 | 11.91 | 51.65 | 0.00 | 0.00 | 17.75 |
Occupational illnesses rate | 0.00 | 0.00 | 0.00 | 0.00 | 0.00 | 0.00 |
Severity rate3 | 137.74 | 11.91 | 103.3 | 0.00 | 0.00 | 31.07 |
Absenteeism rate4 | 3.01 | 0.33 | 6.28 | 0 | 1.17 | 1.16 |
Number of deaths | 0 | 0 | 0 | 0 | 0 | 0 |
1 - The indicator considers employees from the inpEV headquarters and the receiving stations of Taubaté (SP), Rondonópolis (MT), Unaí (MG), Uruçuí (PI), Alto Parnaíba (MA) and Bom Jesus (RS).
2 - The injury rate includes low severity incidents, attended with on premise first aid, and is calculated using the following formula: number of accidents/man-hour of risk exposure x 1,000,000. These injuries include concussions, cuts, falls from one’s own height, etc.
3 - Calculated based on the formula: (lost days + debited days)/ man-hours of risk exposure x 100. Lost days are calculated starting on the day following the accident.
4 - It corresponds to the lost hours/ total hours of work x 100. Lost days are calculated starting on the day following the accident.
 Innovation & technology